This time I’m trying out a monitoring solution: Prometheus.
All I know about it so far:
- pull based, server scrapes /metrics on workloads, human readable format
- scales well because of this
- popular in kuberetes space
Let’s try running the docker iamge
based on the README.
1
| docker run --rm -it -p9090:9090 prom/prometheus:main
|
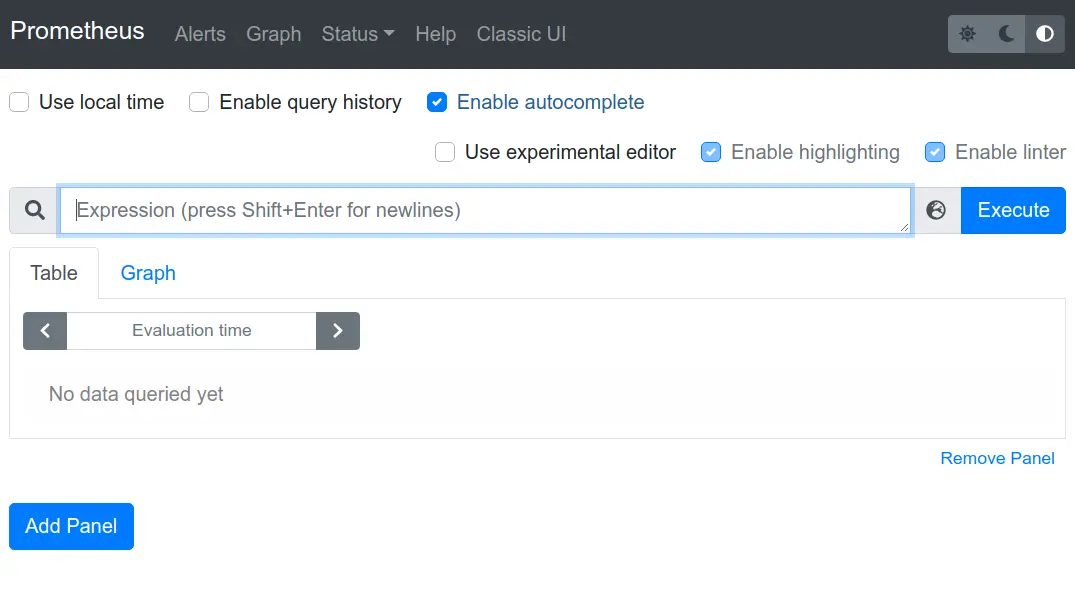
We’ve got lift off! And it’s monitoring itself right out the gate:
docker-compose
I want to add more services now and I don’t want to fiddle with docker run so
time for a compose file.
Consulting with the docs I managed this
 1
 2
 3
 4
 5
 6
 7
 8
 9
10
11
12
13
14
15
16
17
18
19
20
21
| version: '3.7'
volumes:
prometheus_data:
grafana_data:
services:
prometheus:
image: prom/prometheus:v2.28.0
volumes:
- ./prometheus_config/:/etc/prometheus/
- prometheus_data:/prometheus
command:
- '--config.file=/etc/prometheus/prometheus.yml'
- '--storage.tsdb.path=/prometheus'
ports:
- 9090:9090
grafana:
image: grafana/grafana:8.0.3
ports:
- 3000:3000
volumes:
- grafana_data:/var/lib/grafana
|
Yes I threw in a Grafana instance as well.
I based prometheus_config/prometheus.yml of of getting started
1
2
3
4
5
6
7
8
| global:
scrape_interval: 15s # By default, scrape targets every 15 seconds.
scrape_configs:
- job_name: 'prometheus'
scrape_interval: 5s
static_configs:
- targets: ['localhost:9090']
|
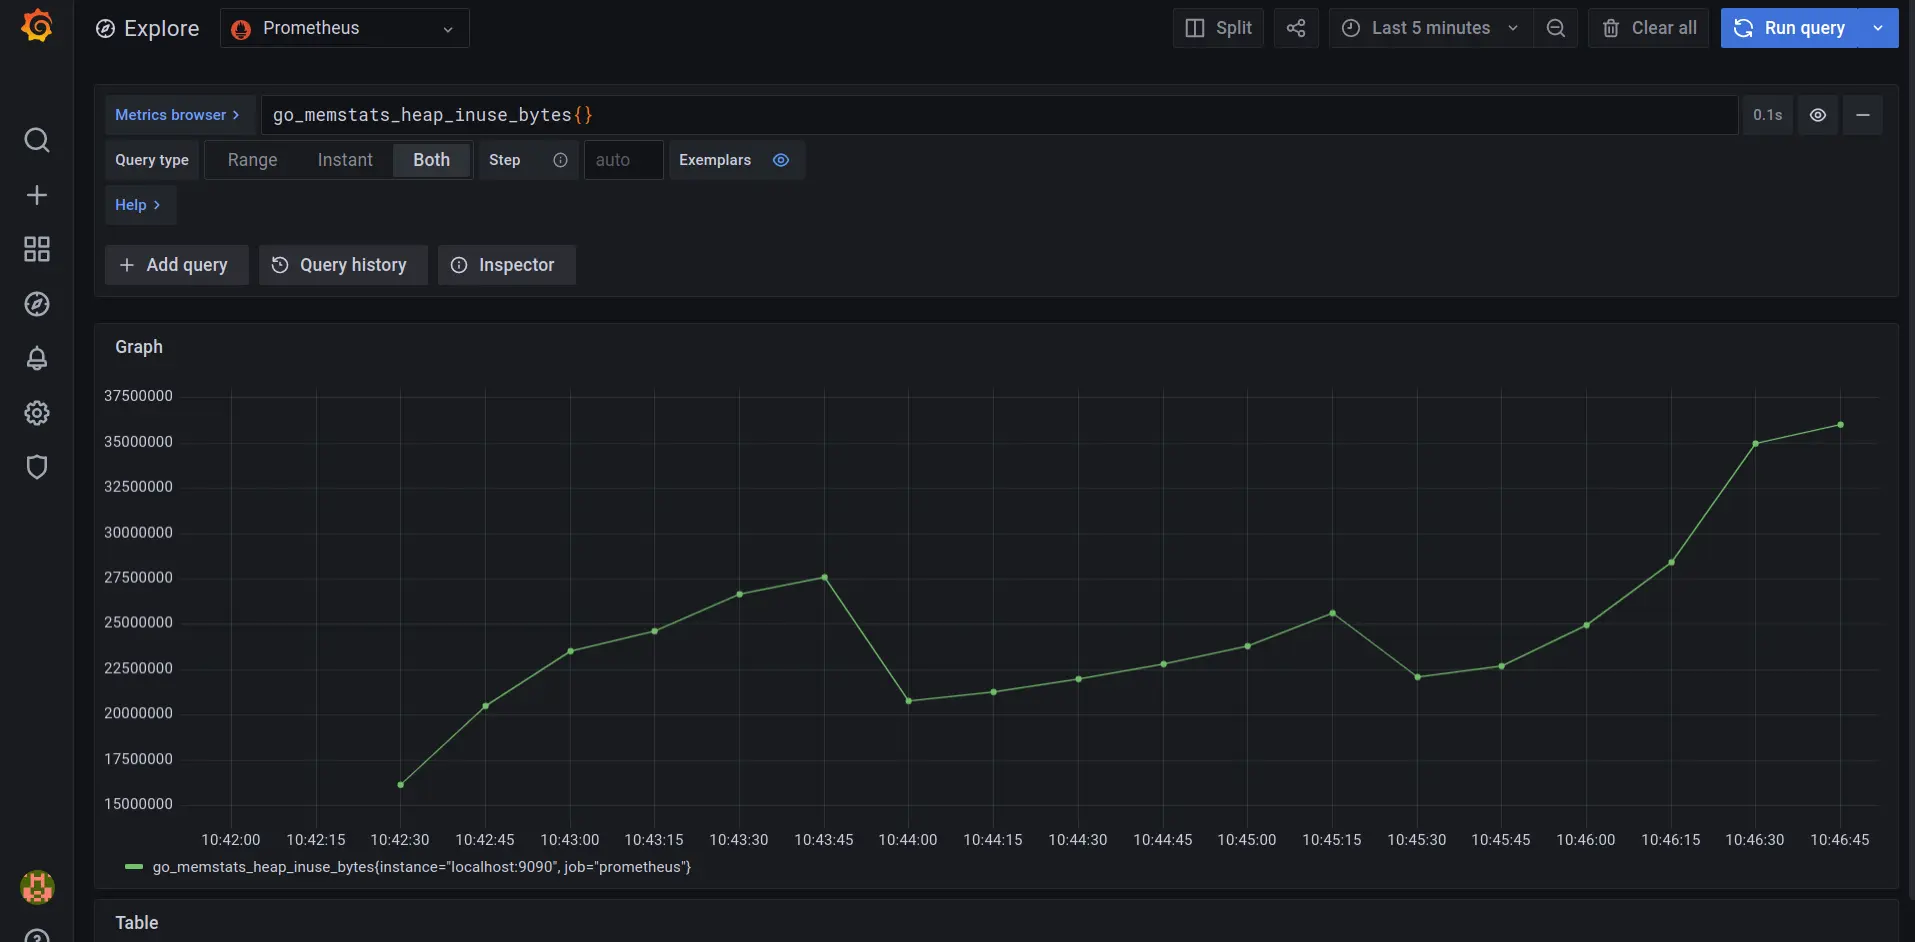
Running docker-compose up -d and we’re off to the races.
http://localhost:9090 gives the same interface (but now with persistent
storage) but there is now Grafana as well (on port 3000)
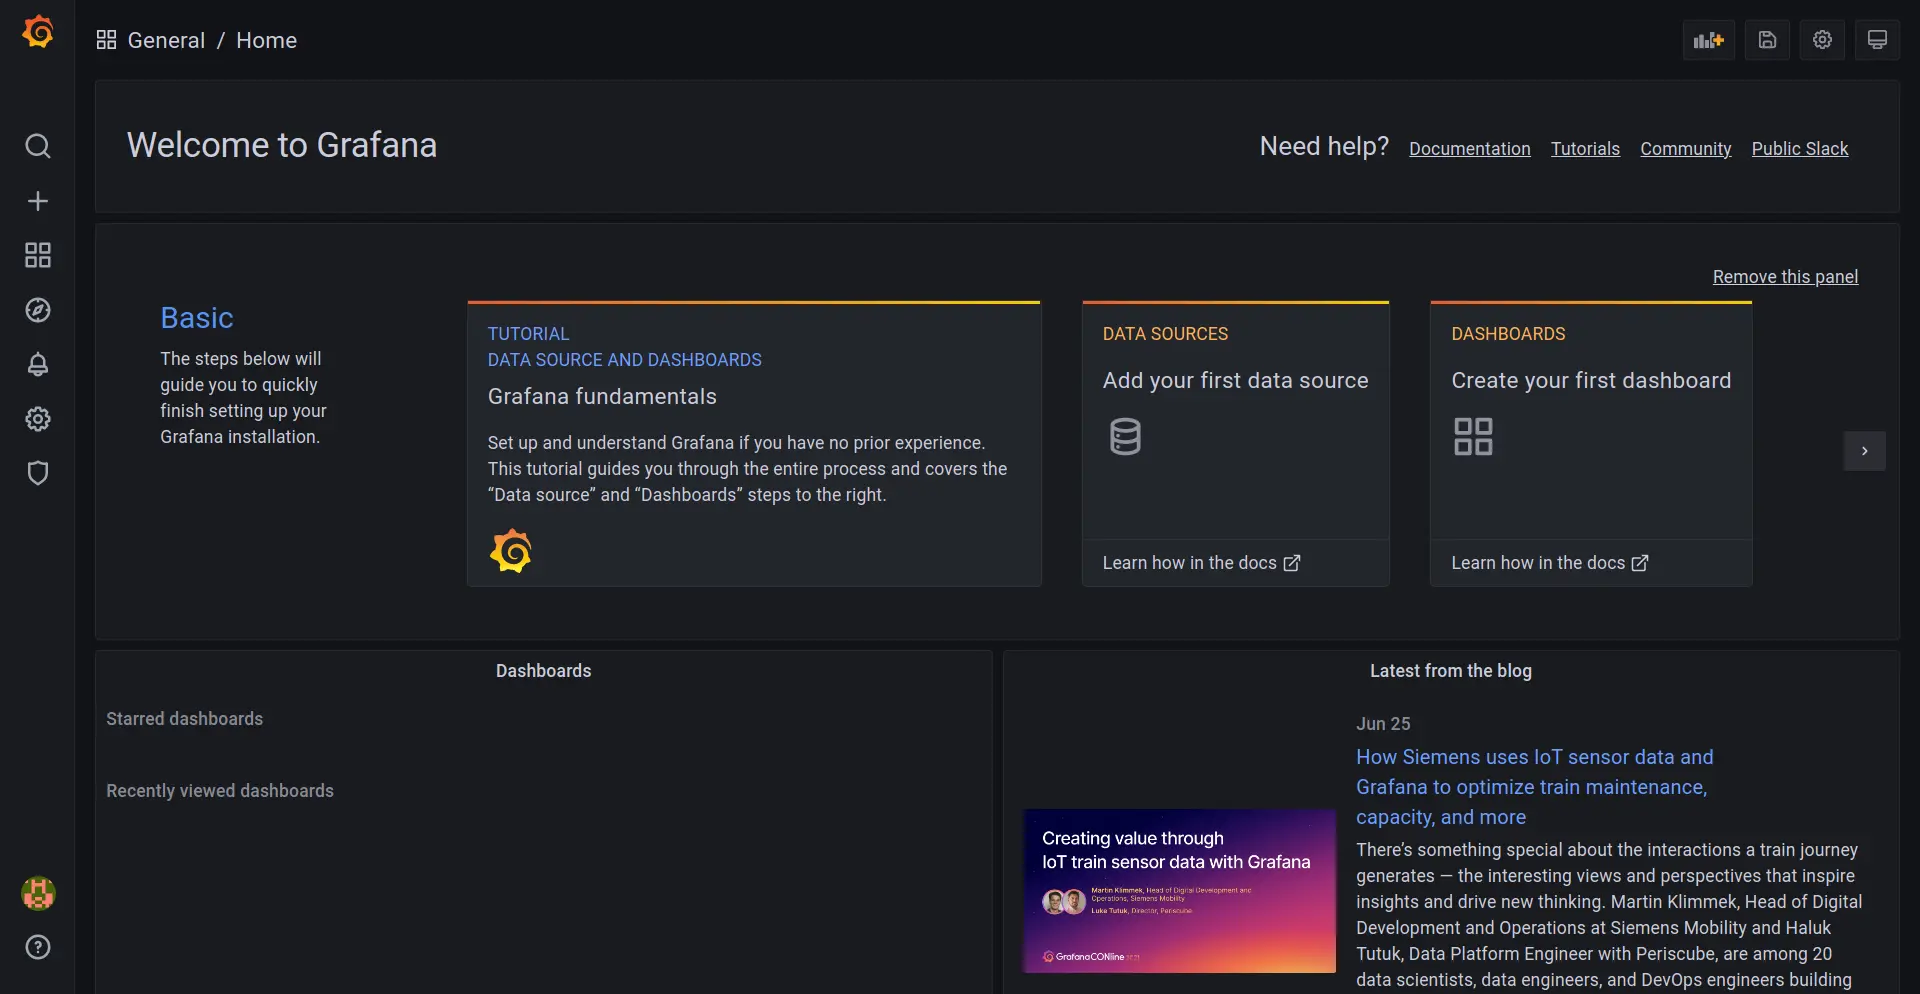
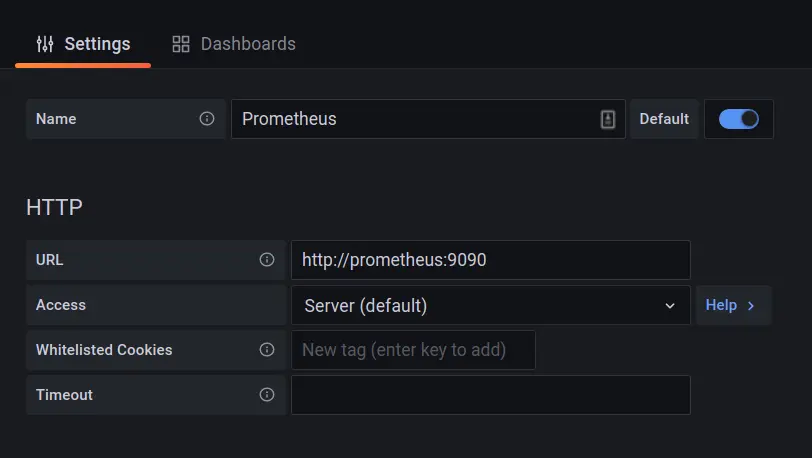
And it can easily be configured to point to the Prometheus instance.
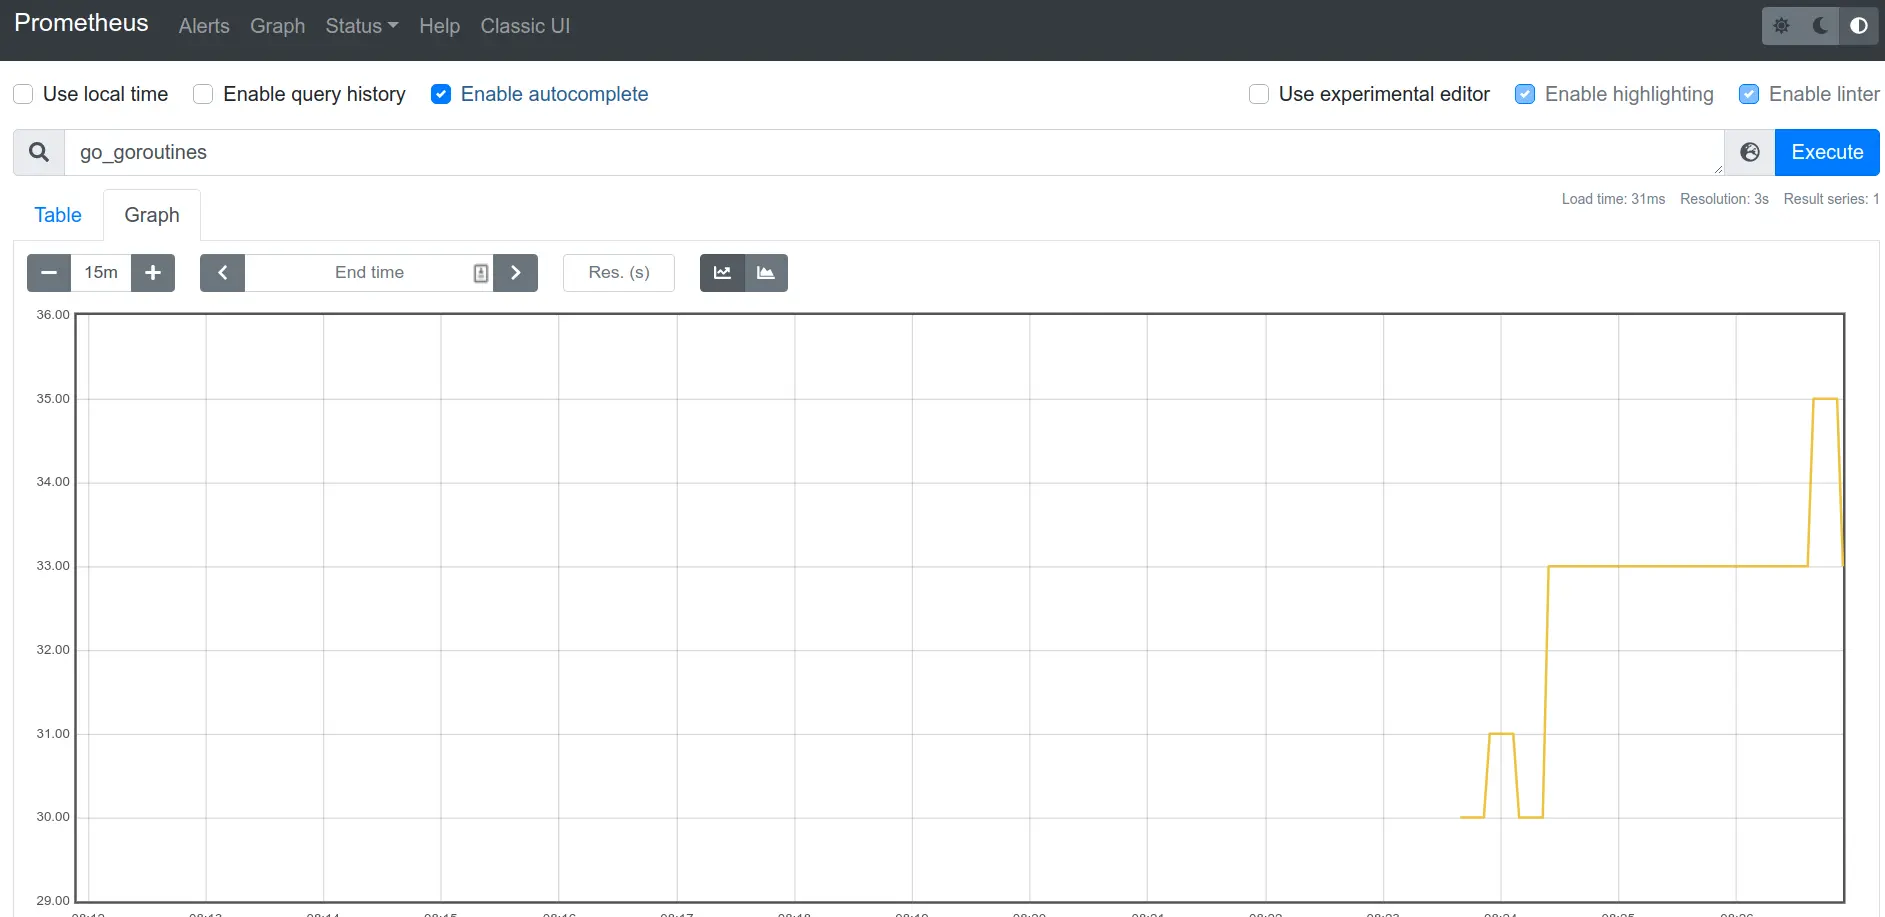
Yaay, metrics in Grafana.
My app
For the next step I want to run my own app and have Prometheus scrape it. To get
started I add gow-based service to my compose
file to have a development friendly environment with auto-recompilation.
1
2
3
4
5
6
7
8
9
| app:
image: golang:1.16-alpine
volumes:
- go:/go
- ./app:/go/src/app
working_dir: /go/src/app
command: go run github.com/mitranim/gow run .
ports:
- 2112:2112
|
And run with docker-compose up app
Init the app with go mod init app and get something up based on the example
from the docs: https://prometheus.io/docs/guides/go-application/
 1
 2
 3
 4
 5
 6
 7
 8
 9
10
11
12
13
14
15
| package main
import (
"log"
"net/http"
"github.com/prometheus/client_golang/prometheus/promhttp"
)
func main() {
addr := ":2112"
log.Println("Starting server on", addr)
http.Handle("/metrics", promhttp.Handler())
http.ListenAndServe(addr, nil)
}
|
I can now curl for metrics from my laptop:
1
2
3
4
5
6
| $ curl -s http://localhost:2112/metrics | head -n5
# HELP go_gc_duration_seconds A summary of the pause duration of garbage collection cycles.
# TYPE go_gc_duration_seconds summary
go_gc_duration_seconds{quantile="0"} 0
go_gc_duration_seconds{quantile="0.25"} 0
go_gc_duration_seconds{quantile="0.5"} 0
|
Great. Now I only need to inform Prometheus about the existence of my app.
Back to getting started
to configure scraping:
1
2
3
4
| - job_name: 'app'
scrape_interval: 5s
static_configs:
- targets: ['app:2112']
|
Apparently SIGHUP to reload config should do the trick
And in another window
1
2
| $ dc kill -s SIGHUP prometheus
Killing prometheus_prometheus_1 ... done
|
Apparently it worked
1
2
| prometheus_1 | level=info ts=2021-06-27T09:05:57.511Z caller=main.go:964 msg="Loading configuration file" filename=/etc/prometheus/prometheus.yml
prometheus_1 | level=info ts=2021-06-27T09:05:57.511Z caller=main.go:995 msg="Completed loading of configuration file" filename=/etc/prometheus/prometheus.yml totalDuration=645.968µs remote_storage=2.492µs web_handler=602ns query_engine=1.266µs scrape=120.724µs scrape_sd=82.519µs notify=1.101µs notify_sd=1.398µs rules=1.343µs
|
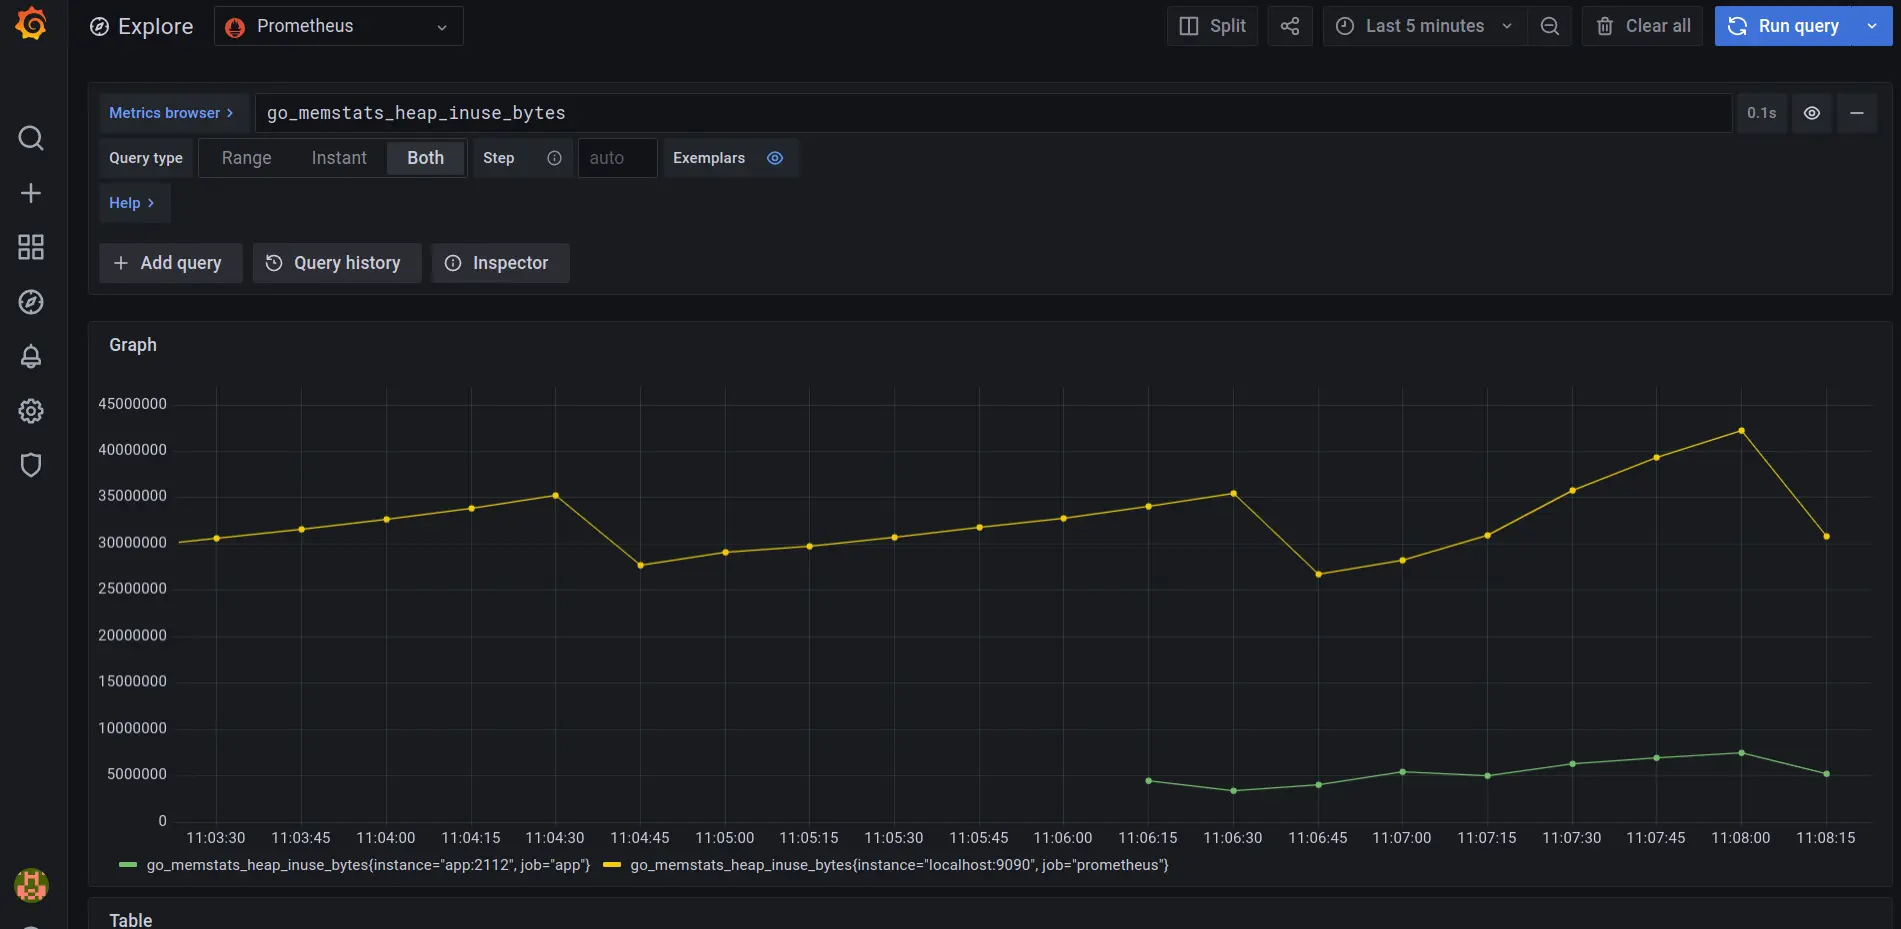
and now “app” shows up in metrics in Grafana!
Request counter
This is still only showing preconfigured metrics. How do I do my custom metrics?
e.g. a request counter.
Based on the same Go docs I
put this together
 1
 2
 3
 4
 5
 6
 7
 8
 9
10
11
12
13
14
15
16
17
18
19
20
21
22
23
24
25
26
27
28
29
30
31
32
33
34
35
36
| package main
import (
"log"
"net/http"
"github.com/prometheus/client_golang/prometheus"
"github.com/prometheus/client_golang/prometheus/promauto"
"github.com/prometheus/client_golang/prometheus/promhttp"
)
func main() {
addr := ":2112"
log.Println("Starting server on", addr)
http.Handle("/metrics", promhttp.Handler())
http.Handle("/", newHandleReq())
http.ListenAndServe(addr, nil)
}
type handleReq struct {
reqCounter prometheus.Counter
}
func newHandleReq() http.Handler {
return &handleReq{
reqCounter: promauto.NewCounter(prometheus.CounterOpts{
Name: "app_req_counter",
Help: "The total number of processed requests",
}),
}
}
func (h *handleReq) ServeHTTP(w http.ResponseWriter, r *http.Request) {
h.reqCounter.Inc()
w.Write([]byte("ok\n"))
}
|
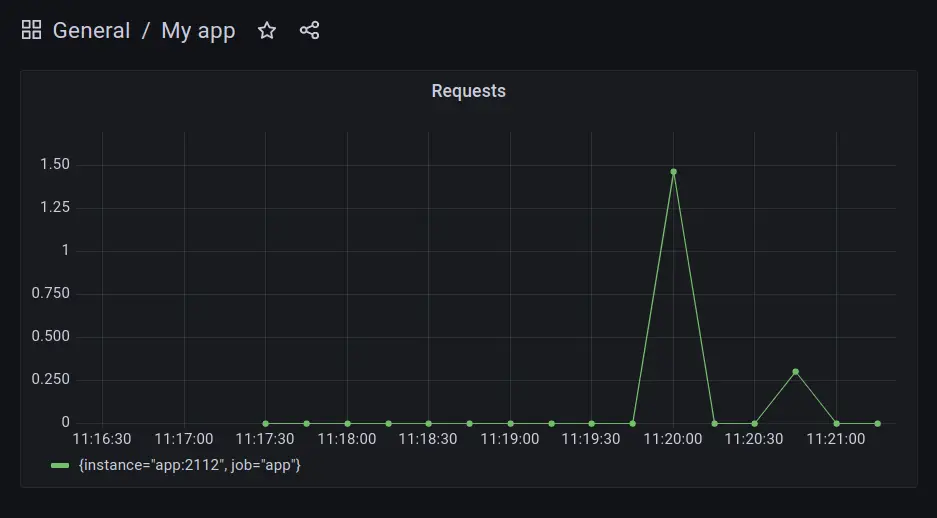
gow picks up changes, and my curl requests do indeed show up in Grafana.
Kuberetes
Now how do I get this running in kubernetes? :D How does this work in context of
pods? Is there some autodetection of scraping targets?
First of all I need a fresh cluster. This time in
minikube
1
2
| $ minikube start
$ eval $(minikube docker-env)
|
Google quickly finds helm
charts
Let’s try it out
1
2
3
| $ helm repo add prometheus-community https://prometheus-community.github.io/helm-charts
$ helm repo update
$ helm repo add prometheus-community https://prometheus-community.github.io/helm-charts
|
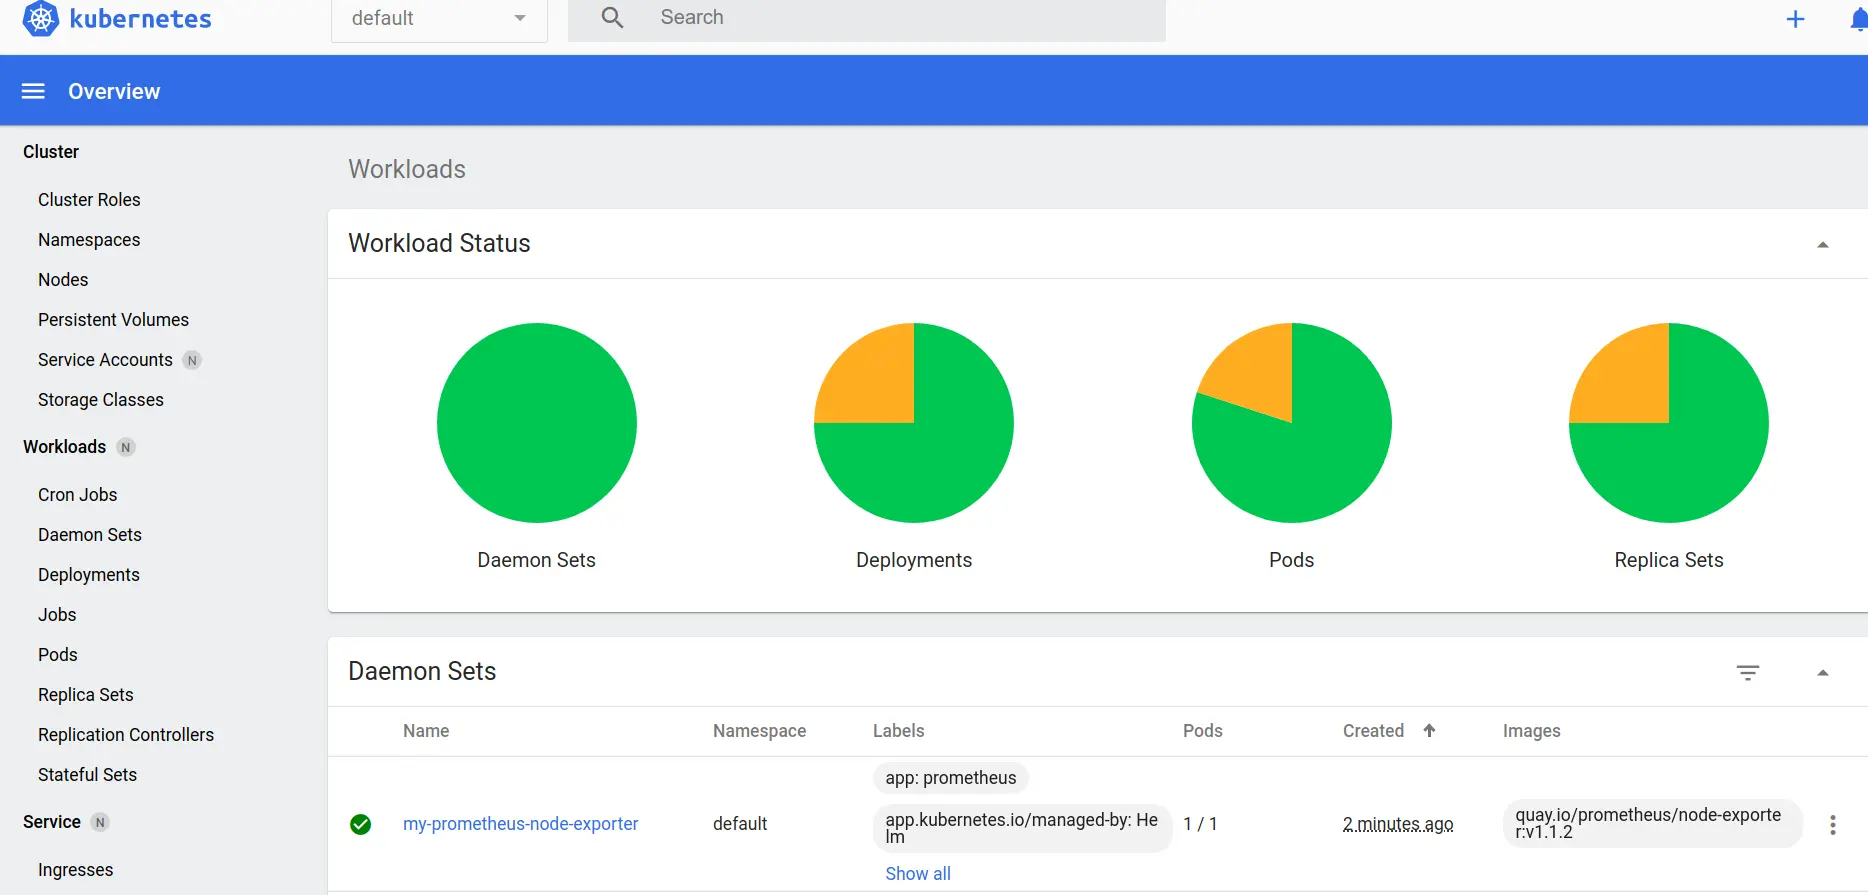
then
and wait for all green
1
2
3
4
5
6
7
8
| $ k get service
NAME TYPE CLUSTER-IP EXTERNAL-IP PORT(S) AGE
kubernetes ClusterIP 10.96.0.1 <none> 443/TCP 11m
my-prometheus-alertmanager ClusterIP 10.110.118.230 <none> 80/TCP 4m45s
my-prometheus-kube-state-metrics ClusterIP 10.102.204.67 <none> 8080/TCP 4m45s
my-prometheus-node-exporter ClusterIP None <none> 9100/TCP 4m45s
my-prometheus-pushgateway ClusterIP 10.100.67.158 <none> 9091/TCP 4m45s
my-prometheus-server ClusterIP 10.104.36.146 <none> 80/TCP 4m45s
|
The chart includes services as well, let’s use port forwarding to access it
1
2
3
| $ k port-forward service/my-prometheus-server 9090:80
Forwarding from 127.0.0.1:9090 -> 9090
Forwarding from [::1]:9090 -> 9090
|
And the regular UI is available again on localhost:9090
Let’s do Grafana as well
 1
 2
 3
 4
 5
 6
 7
 8
 9
10
11
12
13
14
15
16
17
18
19
20
21
22
23
24
25
26
| $ helm repo add grafana https://grafana.github.io/helm-charts
$ helm install my-grafana grafana/grafana
NAME: my-grafana
LAST DEPLOYED: Sun Jun 27 13:37:33 2021
NAMESPACE: default
STATUS: deployed
REVISION: 1
NOTES:
1. Get your 'admin' user password by running:
kubectl get secret --namespace default my-grafana -o jsonpath="{.data.admin-password}" | base64 --decode ; echo
2. The Grafana server can be accessed via port 80 on the following DNS name from within your cluster:
my-grafana.default.svc.cluster.local
Get the Grafana URL to visit by running these commands in the same shell:
export POD_NAME=$(kubectl get pods --namespace default -l "app.kubernetes.io/name=grafana,app.kubernetes.io/instance=my-grafana" -o jsonpath="{.items[0].metadata.name}")
kubectl --namespace default port-forward $POD_NAME 3000
3. Login with the password from step 1 and the username: admin
#################################################################################
###### WARNING: Persistence is disabled!!! You will lose your data when #####
###### the Grafana pod is terminated. #####
#################################################################################
|
Following instructions (but forwading the sirevice directly)
1
2
| kubectl get secret --namespace default my-grafana -o jsonpath="{.data.admin-password}" | base64 --decode ; echo
k port-forward service/my-grafana 3000:80
|
Packaging the app
Time to package up my app
 1
 2
 3
 4
 5
 6
 7
 8
 9
10
| FROM golang:1.16-alpine as builder
COPY . /src
WORKDIR /src
RUN go build .
FROM alpine
WORKDIR /bin/
COPY --from=builder /src/app .
EXPOSE 2112
CMD /bin/app
|
and build (inside minikube’s docker daemon!)
1
| docker build . -t app:latest
|
k8s manifests are the usual boilerplate
 1
 2
 3
 4
 5
 6
 7
 8
 9
10
11
12
13
14
15
16
17
18
19
20
21
22
23
24
25
26
27
28
29
30
31
32
33
34
35
| apiVersion: apps/v1
kind: Deployment
metadata:
name: web
labels:
component: web
spec:
replicas: 1
selector:
matchLabels:
component: web
template:
metadata:
labels:
component: web
spec:
containers:
- name: web
image: app:latest
imagePullPolicy: Never # side-load via minikube
ports:
- containerPort: 2112
---
apiVersion: v1
kind: Service
metadata:
name: web
labels:
component: web
spec:
selector:
component: web
ports:
- protocol: TCP
port: 2112
|
and apply
forward it too
1
| k port-forward service/web 2112
|
Now I can call it from my laptop
1
2
| $ curl http://localhost:2112/
ok
|
now how do I get this into prometheus?
Scraping in k8s
After quite a bit of stumped googling I checked out
values.yaml
of the char I applied and found this explanation
 1
 2
 3
 4
 5
 6
 7
 8
 9
10
11
| # Scrape config for service endpoints.
#
# The relabeling allows the actual service scrape endpoint to be configured
# via the following annotations:
#
# * `prometheus.io/scrape`: Only scrape services that have a value of `true`
# * `prometheus.io/scheme`: If the metrics endpoint is secured then you will need
# to set this to `https` & most likely set the `tls_config` of the scrape config.
# * `prometheus.io/path`: If the metrics path is not `/metrics` override this.
# * `prometheus.io/port`: If the metrics are exposed on a different port to the
# service then set this appropriately.
|
So I figured to add prometheus.io/scrape to my manifests. But where? Service
or pod spec? I Prometheus should scrape pods in my case since I want to get
counter values per-pod.
Updated deployment:
 1
 2
 3
 4
 5
 6
 7
 8
 9
10
11
12
13
14
15
16
17
18
19
20
21
22
23
24
| apiVersion: apps/v1
kind: Deployment
metadata:
name: web
labels:
component: web
spec:
replicas: 1
selector:
matchLabels:
component: web
template:
metadata:
labels:
component: web
annotations:
prometheus.io/scrape: "true"
spec:
containers:
- name: web
image: app:latest
imagePullPolicy: Never # side-load via minikube
ports:
- containerPort: 2112
|
My pod is picked up on localhost:9090/targets, great success.
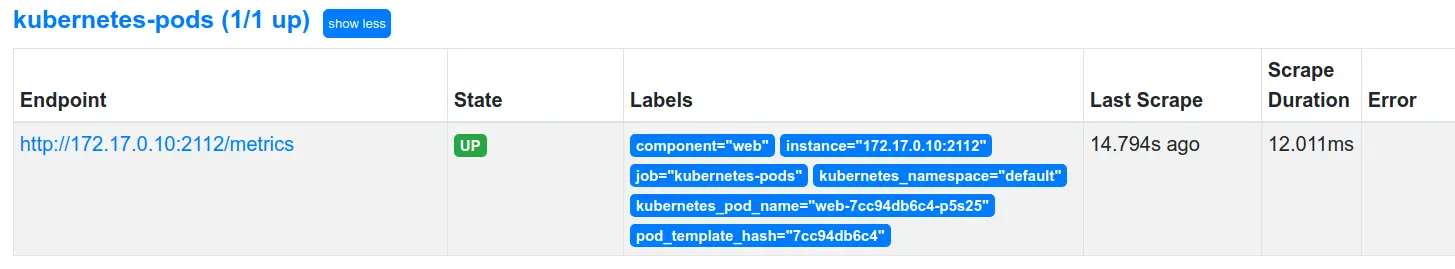
Naturally metrics also show up in Grafana
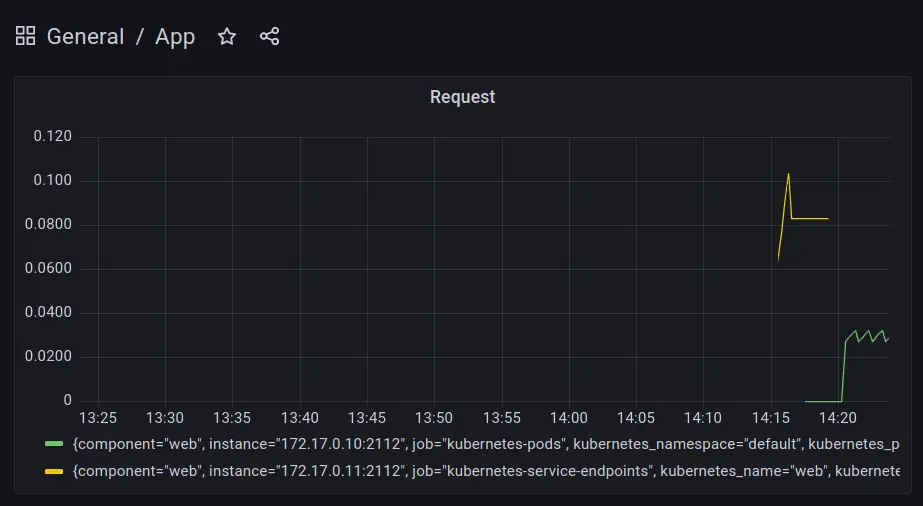
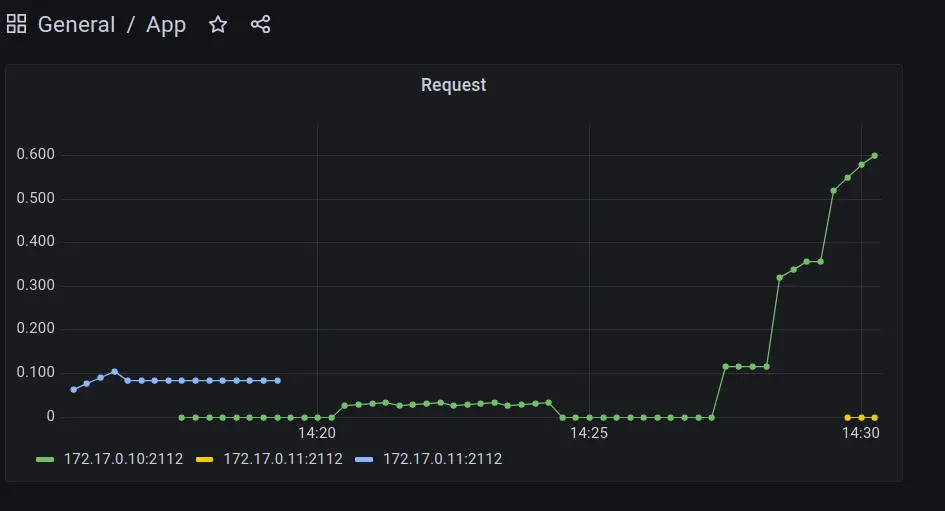
Killing pods/scaling deployment is nicely visible in metrics now.
Conclusion
Setting up Prometheus was actually quite straightforward. So is configuring the
actual scraping. Application codebase doesn’t need to know anything about my
infrastructure, no configuration needed - it simply exposes a /metrics/
endpoint. Then scraping is enabled in my deployment manifest.
For me the part that actually needs some getting used to is the query language,
but I think the infrastructure niceties are well worth it.